Lars Ludwig · 7 September 2026
Decoding Environmental Changes with Advanced Radar Analytics
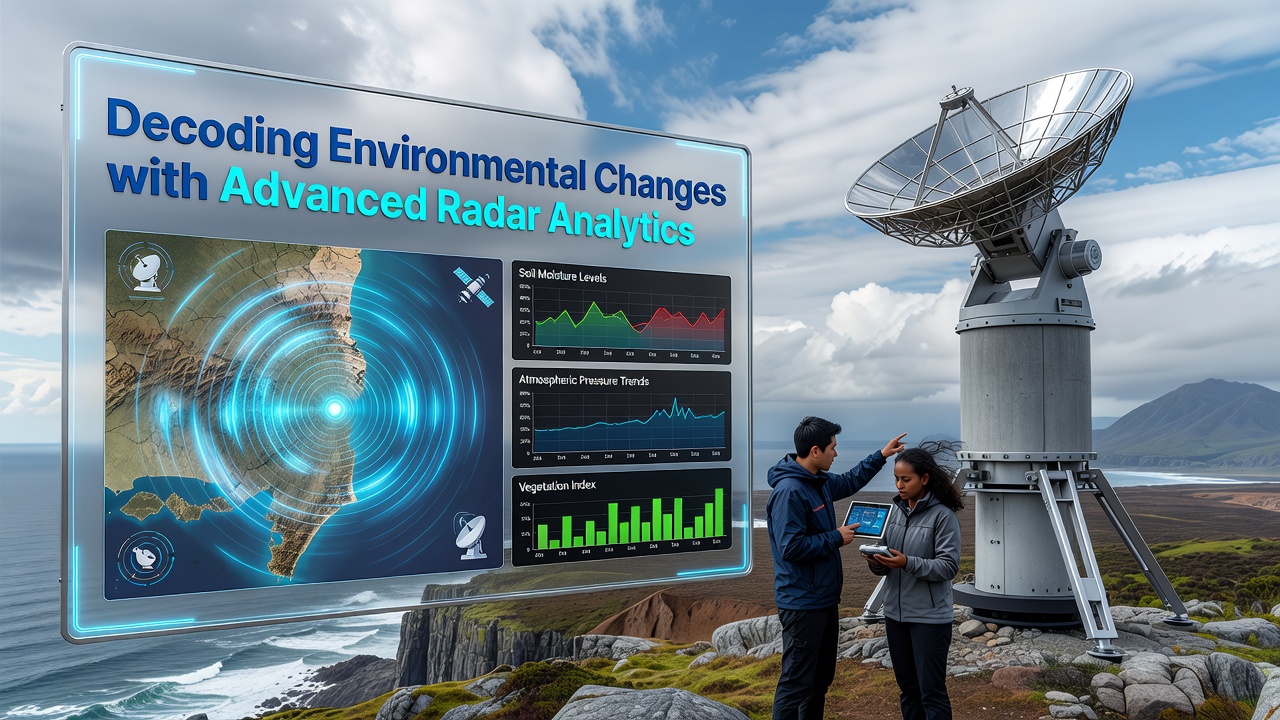
Advanced radar systems now track shifts in forests, ice sheets, coastlines and agricultural zones with precision that optical satellites alone cannot match, since radar waves penetrate clouds and operate day or night without interruption. Synthetic aperture radar, or SAR, forms detailed images by combining multiple radar pulses collected along a satellite's flight path, and analysts then apply interferometric techniques to measure surface movement down to millimeters. Data from missions operated by agencies such as the European Space Agency and NASA feed into processing pipelines that convert raw echoes into maps of elevation change, vegetation structure and soil moisture.
How Radar Analytics Reveal Subtle Shifts
Interferometric SAR compares phase differences between two radar acquisitions of the same location taken at different times, and the resulting interferogram highlights deformation caused by subsidence, volcanic inflation or glacial flow. Time-series stacks built from dozens of passes allow researchers to separate seasonal cycles from longer-term trends, while machine-learning classifiers sort pixels into categories such as flooded vegetation, bare soil or built infrastructure. These methods work across all weather conditions because microwave signals reflect from the surface rather than depending on sunlight, so coverage remains continuous even during monsoon seasons or polar winter darkness.
Global Monitoring Programs and Data Streams
The Copernicus Sentinel-1 constellation supplies free SAR imagery every six to twelve days for most land areas, and analysts combine these observations with optical datasets to produce land-cover maps updated quarterly. NASA's NISAR mission, scheduled for launch before 2026, will add L-band and S-band channels that penetrate deeper into vegetation canopies and provide finer resolution over ice sheets. Observers note that by September 2026 the first full-year NISAR archive is expected to support new global biomass estimates, while existing Sentinel-1 records already exceed eight years in length and allow trend detection across entire continents.
Applications in Key Environmental Domains
Forestry agencies use radar-derived canopy height models to estimate biomass loss after selective logging, and studies show that repeat-pass measurements detect gaps as small as 0.25 hectares within dense tropical cover. In the cryosphere, InSAR tracks ice-shelf rift propagation and grounding-line migration, providing early indicators of accelerated discharge into the ocean. Agricultural services apply soil-moisture retrievals from radar backscatter to forecast drought stress weeks before visible wilting appears in crops, and water-resource managers integrate these layers with river-gauge data to refine reservoir release schedules.
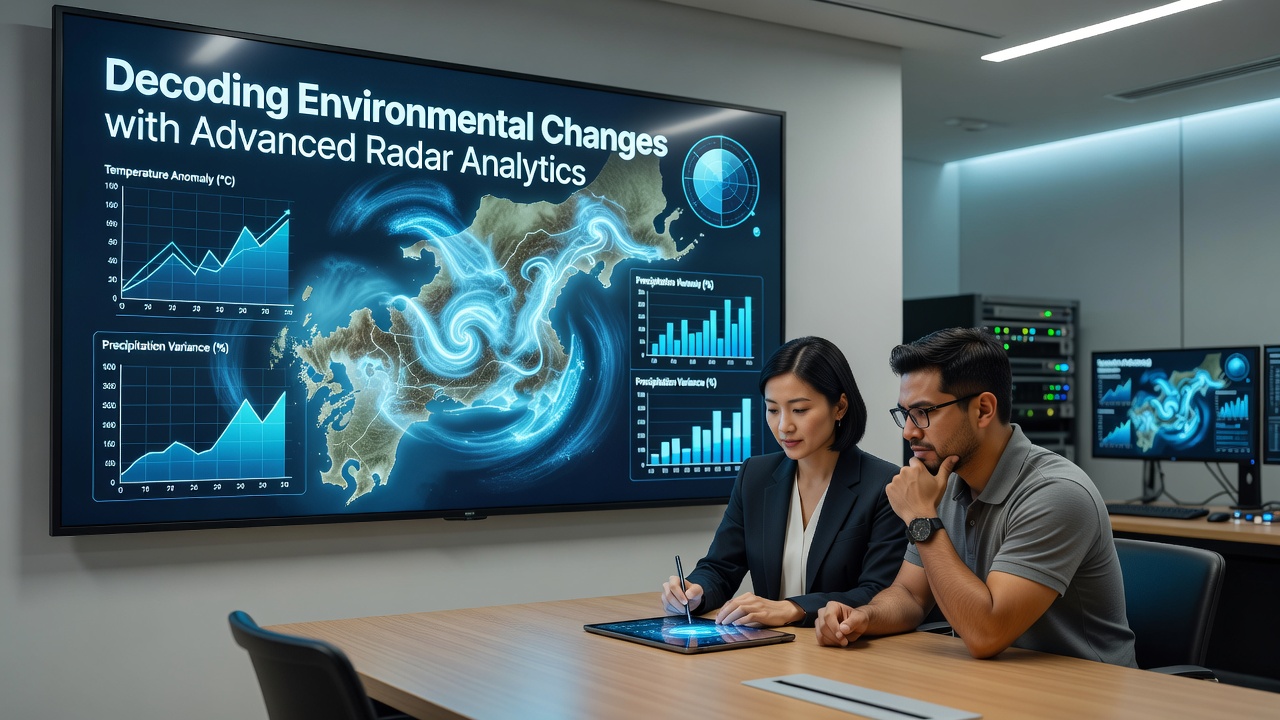
Urban planners examine subsidence maps produced from persistent scatterer techniques to identify neighborhoods where groundwater extraction causes measurable sinking, and coastal engineers overlay these maps with tide-gauge records to separate vertical land motion from absolute sea-level rise. One study covering the Mekong Delta combined Sentinel-1 time series with in-situ leveling and found average subsidence rates exceeding 2 centimeters per year in several provinces, information now used to update flood-risk models.
Processing Pipelines and Analytical Tools
Open-source toolkits such as ESA's SNAP software and NASA's ISCE framework allow research groups to generate interferograms and coherence maps without proprietary licenses, and cloud platforms host pre-processed analysis-ready datasets that reduce the need for local storage. Automated change-detection algorithms flag pixels whose backscatter or coherence deviates beyond historical variability thresholds, and human analysts review only the flagged subsets before publishing alerts. These workflows scale from regional case studies to near-global products because the underlying radar archives are distributed through standardized catalogs that support programmatic queries.
Integration with Complementary Datasets
Radar measurements gain additional value when fused with lidar elevation models, GNSS station velocities and optical vegetation indices, and joint inversions yield three-dimensional displacement fields that separate horizontal and vertical components. Climate-impact assessments now routinely incorporate such fused products, because radar supplies the all-weather backbone while optical and lidar layers add spectral detail and absolute height references. Government agencies in Canada and Australia publish regular reports that blend these sources, and the resulting bulletins inform national adaptation strategies for permafrost thaw and coastal erosion.
Conclusion
Radar analytics continue to expand the temporal and spatial coverage of environmental observations, delivering consistent measurements regardless of cloud cover or daylight. As new missions come online and processing methods mature, the volume of actionable information grows, supporting evidence-based decisions across forestry, agriculture, water management and disaster risk reduction. The combination of open data policies, standardized processing tools and multi-sensor fusion ensures that these capabilities remain accessible to researchers and planners worldwide.